
Free-market US Dollar (USD/IRR) Extends Gains, Reaches 30-Day High
The Free-market US Dollar (USD/IRR) closed at 2,719,050 IRR on October 22, 2026, marking its fourth consecutive session of gains. The instrument reached a se...
Market Summary
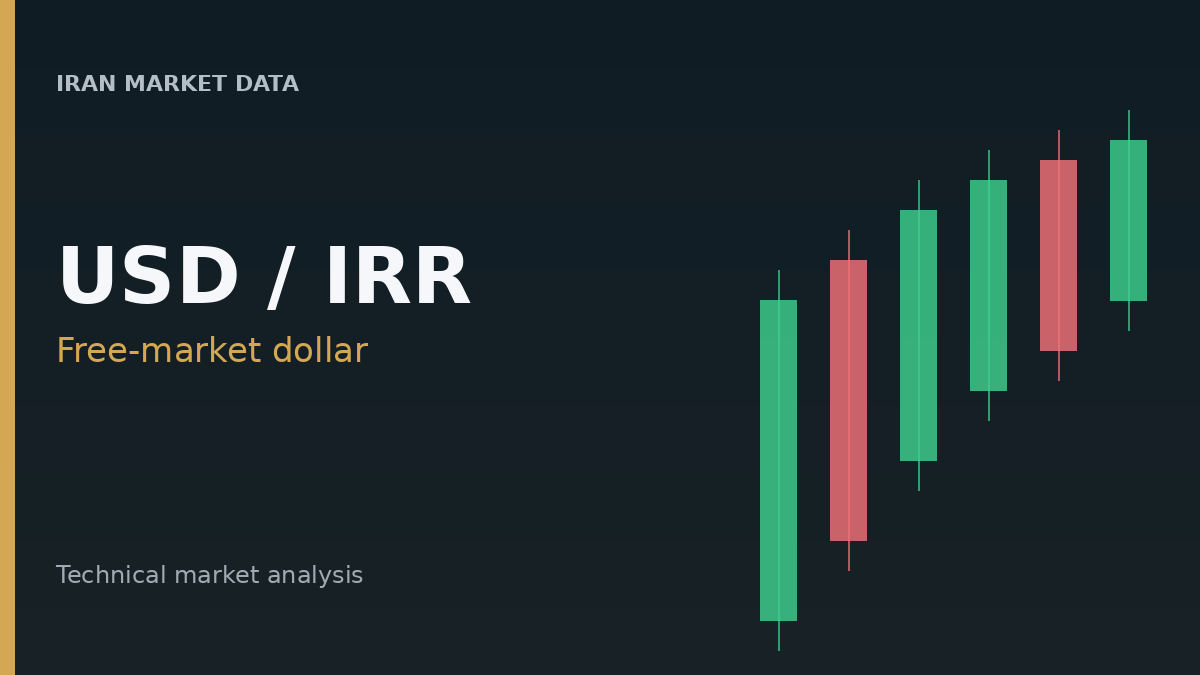
The Free-market US Dollar (USD/IRR) closed at 2,719,050 IRR on October 22, 2026, marking its fourth consecutive session of gains. The instrument reached a session high of 2,732,000 IRR, which also represents the highest price observed in the past 30 days. The closing price for the day is also the highest recorded close in the last 30 days.
Interactive price chart
Market Analysis
Today's trading session for USD/IRR saw the instrument open at 2,705,850 IRR before advancing to a high of 2,732,000 IRR. While the price retreated slightly from its peak, it maintained a positive trajectory to close at 2,719,050 IRR. This latest close extends a series of upward movements, with the USD/IRR having posted gains for four consecutive days.
The broader market structure indicates a bullish trend, with the price trading above its 20-day, 50-day, and 200-day Simple Moving Averages (SMAs). The current price is also notably close to its 52-week high, standing just 0.47% away. The session's high of 2,732,000 IRR aligns with the identified resistance level.
Technical Highlights
Technical indicators largely support the prevailing bullish sentiment, though some suggest potential overextension. The Average Directional Index (ADX) at 40.39 indicates a strong trend, with the Plus Directional Indicator (+DI) significantly above the Minus Directional Indicator (-DI), reinforcing the upward momentum.
The Relative Strength Index (RSI) stands at 70.25, moving into overbought territory, which often suggests that the asset may be due for a consolidation or pullback. Similarly, the Commodity Channel Index (CCI) at 147.19 points to strong upward momentum.
The price is trading near the upper Bollinger Band, which is at 2,729,913.88 IRR, further indicating that the recent upward move might be extended. However, the MACD histogram shows a negative value of -9,982.73, implying that the MACD line has crossed below its signal line, which could signal a short-term weakening in momentum despite the price gains. Both the Supertrend and Parabolic SAR indicators continue to signal an upward trend.
Conclusion
The Free-market US Dollar (USD/IRR) has demonstrated a clear bullish trend, marked by four consecutive daily gains and a 30-day high close. The price is trading above key moving averages and is approaching its 52-week high. While momentum indicators like ADX and CCI confirm the strong upward movement, the RSI suggests overbought conditions, and the MACD histogram indicates a potential short-term deceleration in momentum. The available market data alone do not indicate the underlying cause of the observed price movement.
Live rates
Track the latest Free-market US Dollar (USD/IRR) session on Iran Market Data.