
18K Gold per gram (IRR) Records Third Consecutive Daily Gain
18K Gold per gram in Iranian Rial (IRR) closed higher on July 29, 2026, marking its third consecutive day of gains. The session saw the price open at its low...
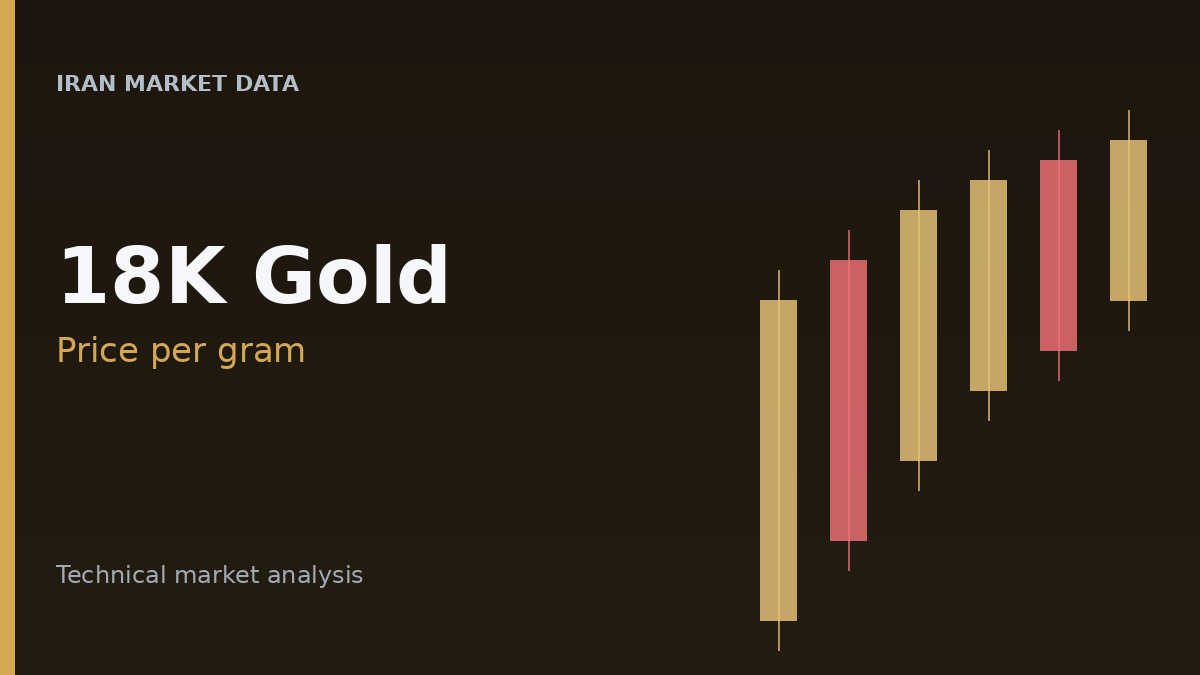
Market Summary
18K Gold per gram in Iranian Rial (IRR) closed higher on July 29, 2026, marking its third consecutive day of gains. The session saw the price open at its low and advance throughout the day, closing at IRR 188,102,000.
Interactive price chart
Market Analysis
The latest session for 18K Gold per gram (IRR) concluded with a notable upward movement. The price opened at IRR 183,404,000, which also served as the session's low, before reaching a high of IRR 189,886,000 and settling at a close of IRR 188,102,000. This daily performance extends a recent positive trend, with the asset recording three consecutive days of gains.
Analysis of recent price action reveals a pattern of higher lows and higher highs since July 26. The low of IRR 178,251,000 on July 26 was followed by successive higher lows at IRR 178,787,000, IRR 182,100,000, and IRR 183,404,000. Similarly, daily highs have increased from IRR 182,568,000 on July 26 to IRR 189,886,000 in the latest session. The market structure indicates a bullish trend, with the current price trading above its 20-day, 50-day, and 200-day Simple Moving Averages. The asset is also positioned significantly closer to its 52-week high than its 52-week low.
Technical Highlights
Momentum indicators present a mixed picture within the broader bullish trend. The 14-period Relative Strength Index (RSI) stands at 58.21, indicating positive momentum without entering overbought territory. The Average Directional Index (ADX) at 22.17 suggests the presence of a trend, with the Plus Directional Indicator (+DI) at 33.62 exceeding the Minus Directional Indicator (-DI) at 22.27, supporting the upward direction.
However, the Moving Average Convergence Divergence (MACD) shows its line slightly below its signal line, and the MACD histogram is negative at -45,808, suggesting a potential moderation in bullish momentum. Furthermore, the Aroon indicator shows Aroon Down at 100 and Aroon Up at 41.67, with a negative Aroon Oscillator, which could imply that recent lows have been more prominent than recent highs in its calculation, contrasting with the observed higher highs and lows in daily price action. The price is currently trading above the Supertrend indicator (IRR 176,664,241) and the Parabolic SAR (IRR 178,251,000), both of which confirm the prevailing upward trend.
Conclusion
18K Gold per gram (IRR) concluded the July 29 session with a third consecutive daily gain, characterized by higher lows and higher highs over recent sessions. The price is trading above key moving averages, reinforcing a bullish market structure. While momentum indicators like RSI and ADX support the upward trend, the MACD histogram suggests a slight easing of bullish momentum, and the Aroon indicator presents a divergent view regarding the prominence of recent highs versus lows. The available market data alone do not indicate the underlying cause of the observed price movement.
Live rates
Track the latest 18K Gold per gram (IRR) session on Iran Market Data.