
18K Gold per gram (IRR) Records Second Consecutive Daily Gain
18K Gold per gram in Iranian Rial (IRR) closed higher on July 28, 2026, marking its second consecutive day of gains. The asset settled at 183,413,000 IRR, bu...
Market Summary
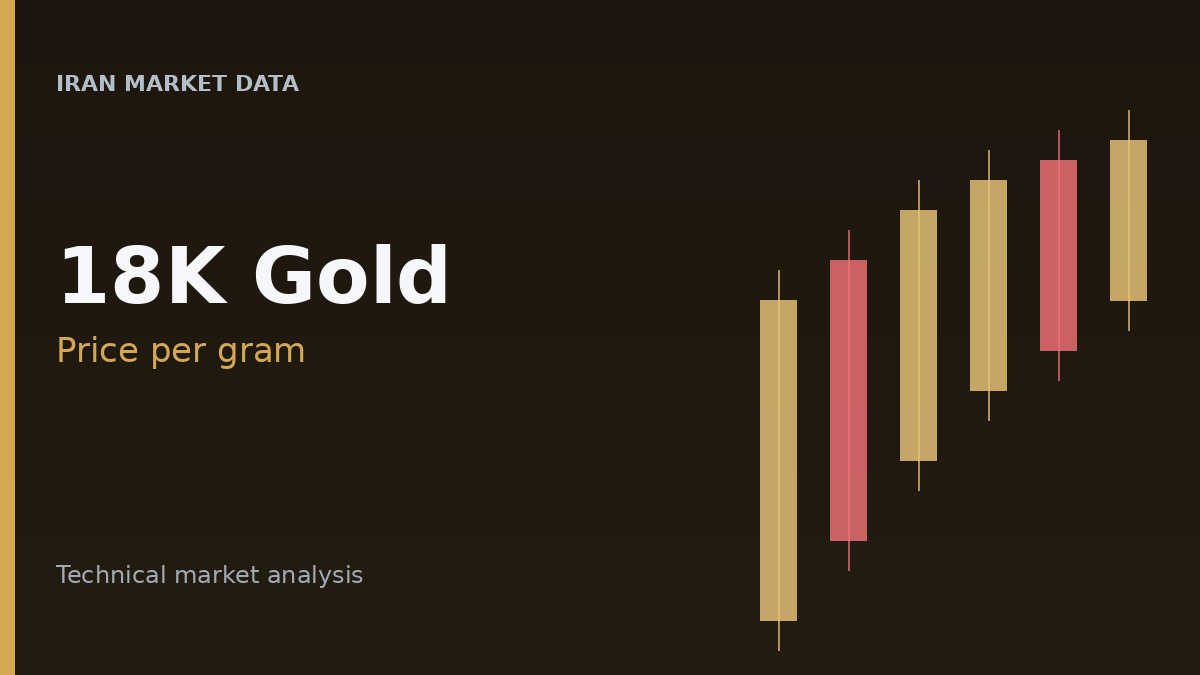
18K Gold per gram in Iranian Rial (IRR) closed higher on July 28, 2026, marking its second consecutive day of gains. The asset settled at 183,413,000 IRR, building on the previous session's advance.
Interactive price chart
Market Analysis
The latest session for 18K Gold per gram opened at 182,100,000 IRR, which also represented the session's low. Prices subsequently advanced to a high of 185,292,000 IRR before closing at 183,413,000 IRR. This close reflects an increase from the previous session's close of 182,093,000 IRR, extending the asset's upward movement to two consecutive days. The overall market structure indicates a bullish trend, with the price trading above its 20-day, 50-day, and 200-day Simple Moving Averages. Key levels to observe include support at 174,396,000 IRR and resistance at 191,456,000 IRR.
Technical Highlights
The 14-period Relative Strength Index (RSI) stands at 53.61, indicating moderately positive momentum. However, the MACD histogram is negative at -299,313.95, suggesting that the MACD line has crossed below its signal line, which can signal a weakening of bullish momentum. The Average Directional Index (ADX) is at 22.31, below the 25 threshold, implying a lack of strong trend strength. While the Supertrend indicator maintains a bullish signal, with the price trading above its current level of 176,664,241 IRR, other indicators present conflicting views. The Parabolic SAR (PSAR) is positioned above the current price at 189,617,623.94 IRR, suggesting a potential bearish reversal. This is further supported by the Aroon indicator, which shows Aroon Down at 100 and Aroon Up at 37.5, resulting in a negative Aroon Oscillator of -62.5, typically pointing to a strong downtrend.
Conclusion
18K Gold per gram (IRR) registered a second consecutive daily gain, with the price trading above key moving averages and the overall trend identified as bullish. However, several technical indicators, including the MACD histogram, PSAR, and Aroon, suggest weakening momentum or conflicting trend signals. The available market data alone do not indicate the underlying cause of the observed price movement.
Live rates
Track the latest 18K Gold per gram (IRR) session on Iran Market Data.