
Emami Gold Coin (IRR) Declines as Short-Term Momentum Weakens
On August 2, 2026, the Emami Gold Coin (IRR) experienced a decline, closing the session at 1,839,900,000 Iranian Rial. This marks a decrease from the previou...
Market Summary
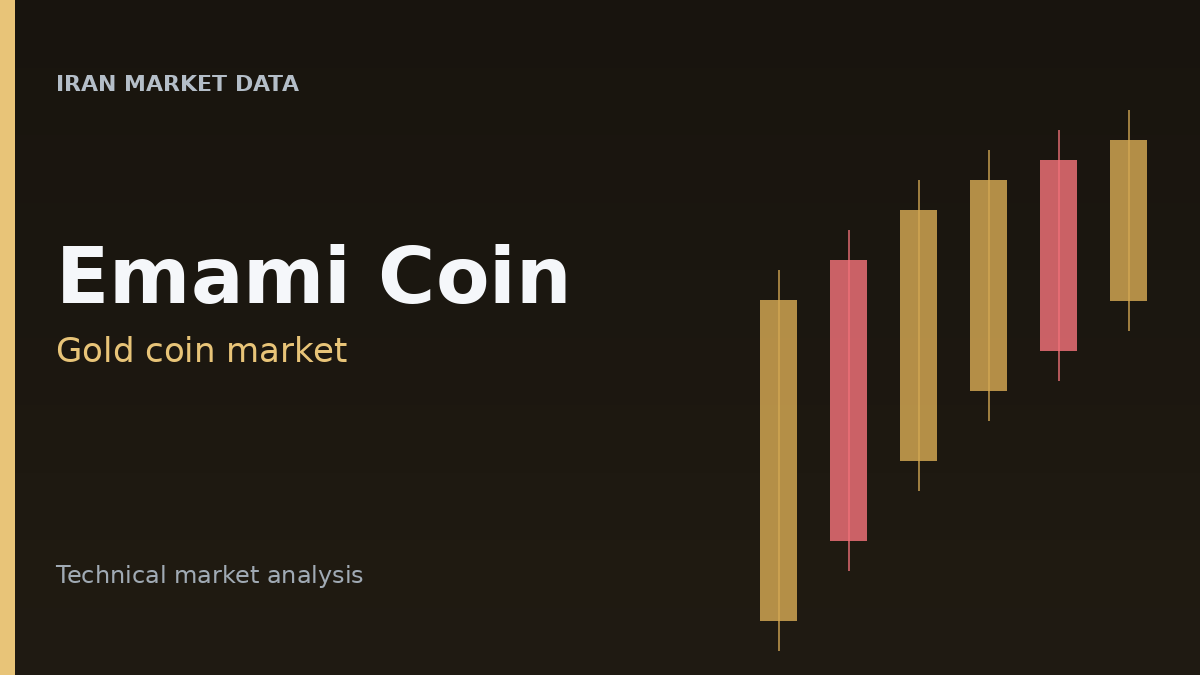
On August 2, 2026, the Emami Gold Coin (IRR) experienced a decline, closing the session at 1,839,900,000 Iranian Rial. This marks a decrease from the previous day's close and represents the first daily decline after two sessions of either gains or flat performance. The trading session was characterized by a wider range compared to the preceding day, with the coin opening at 1,850,050,000 IRR.
Interactive price chart
Market Analysis
The Emami Gold Coin opened the August 2 session at 1,850,050,000 IRR, reaching an intraday high of 1,850,100,000 IRR before falling to a low of 1,819,800,000 IRR and closing at 1,839,900,000 IRR. This closing price is notably lower than the 1,880,100,000 IRR recorded at the close of the previous session. The daily price action saw both the session's high and low register below those of the prior day, indicating a shift in intraday dynamics. The current close is the lowest observed since July 26.
Despite the recent daily decline, the overall market structure for the Emami Gold Coin is identified as bullish. The price remains positioned above its 50-day and 200-day Simple Moving Averages, which stand at 1,784,191,000 IRR and 1,790,377,500 IRR, respectively. However, the coin closed below its 20-day Simple Moving Average of 1,845,480,000 IRR, suggesting a short-term pullback within the broader trend.
Technical Highlights
Several technical indicators reflect a weakening of short-term momentum for the Emami Gold Coin.
The MACD histogram has turned negative, and the MACD line is positioned below its signal line, indicating a recent shift towards bearish momentum. This suggests that the upward price pressure observed previously may be easing.
The Average Directional Index (ADX), at 15.16, suggests a weak overall trend strength, falling below the threshold typically associated with strong trending markets. Concurrently, the Minus Directional Indicator (-DI) is higher than the Plus Directional Indicator (+DI), signaling an increase in bearish directional movement.
The Parabolic SAR (PSAR) is currently positioned above the price, which typically acts as a bearish signal, suggesting a potential reversal or continuation of a downward trajectory.
Furthermore, the Aroon indicator shows Aroon Down significantly higher than Aroon Up, resulting in a negative Aroon Oscillator. This configuration reinforces the observation of increasing downward momentum in the short term.
Conclusion
The Emami Gold Coin (IRR) experienced a notable decline on August 2, 2026, interrupting a period of relative stability. While the broader market trend remains bullish, as indicated by its position relative to longer-term moving averages, several short-term technical indicators point to a weakening of upward momentum and an increase in bearish pressure. The available market data alone do not indicate the underlying cause of the observed price movement.
Live rates
Track the latest Emami Gold Coin (IRR) session on Iran Market Data.